Zoom in on Palm Coast with Interactive Mapping Tool Released Today by U.S. Census Bureau
Compare neighborhood level statistics interactively; where you live to where you are from or to where your relatives or friends live.
|
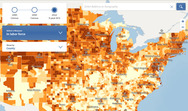
Palm Coast, FL — December 17, 2013 — The U.S. Census Bureau released Census Explorer, a new interactive mapping tool that gives users easier access to neighborhood level statistics. The mapping tool uses updated statistics from the 2008-2012 American Community Survey (ACS), which were also released today. The new application allows users to map out different social, economic and housing characteristics of their state, county or census tract, and to see how these areas have changed since the 1990 and 2000 censuses. The mapping tool is powered by American Community Survey statistics from the Census Bureau’s API, an application programming interface that allows developers to take data sets and reuse them to create online and mobile apps. |
“The American Community Survey data are critically important to powering our nation’s 21st century economy,” U.S. Secretary of Commerce Penny Pritzker said. “Making data more accessible and user-friendly for all Americans is a top priority of our ‘Open for Business Agenda’ at the Department of Commerce. The rich statistics in the 2008-2012 ACS will help more businesses, policymakers and communities make better-informed decisions that will help propel U.S. economic growth. ”
The tool allows users to look at the following eight statistics from the American Community Survey:
- Total population
- Percent 65 and older
- Foreign-born population percentage
- Percent of the population with a high school degree or higher
- Percent with a bachelor’s degree or higher
- Labor force participation rate
- Home ownership rate
- Median household income
In addition to these characteristics, more than 40 social, economic and housing topics are now available through the American Community Survey statistics for all communities in the nation, regardless of size, down to the block group level. For example, health insurance coverage statistics are now available for the first time at the neighborhood level.
Additional Exploration Tools
A variety of other Census Bureau data tools have been updated with today’s new numbers, including the Census Bureau’s application programming interface, Easy Stats and American FactFinder. In addition to the updated exploration tools, the Census Bureau is releasing narrative profiles which allow users to explore a graphical and narrative presentation of the statistics from the American Community Survey.
About the American Community Survey
The American Community Survey provides a wide range of important statistics about all communities in the country. The American Community Survey gives communities the current information they need to plan investments and services. Retailers, homebuilders, police departments, and town and city planners are among the many private- and public-sector decision makers who count on these annual results. Ever since Thomas Jefferson directed the first census in 1790, the census has collected detailed characteristics about our nation's people.
The Census Bureau uses information collected over five years from the American Community Survey in order to have more accurate and reliable statistics for areas with populations smaller than 20,000. Statistics for larger areas are also included with this release, making comparisons across large and small geographies possible.
The Census Bureau is currently reviewing all of the questions on the American Community Survey to ensure adequate coverage of statistical information that communities rely on. The survey is the only source of local statistics for most of the 40 topics it covers, such as educational attainment, housing, employment, commuting, language spoken at home, nativity, ancestry and selected monthly homeowner costs down to the smallest communities. The Census Bureau is inviting the public to give feedback on each question asked in the survey. For more information on the review process, please visit the American Community Survey content review website for more details.
Q&As
Which boundaries does Census Explorer use for the maps?
Each decennial census map uses the boundaries that existed in the year the data were collected. So, the map for the 1990 Census uses 1990 boundaries, the map for the 2000 Census uses 2000 boundaries. The ACS 2008-2012 5-year data use 2012 boundaries.
Do you plan to add more topics to Census Explorer beyond the current eight topics?
We'd like to add more topics to this tool in the future, depending on resources and how well this first version is received. This is a pilot. Census Explorer uses easy and familiar mapping tools to let anyone zoom in or enter the address for the data they'd like to see. Our goal is to make data accessible to anyone. That's why we've launched tools such as our API and mobile apps.
I see some differences in the geographic details between the different maps, beyond boundary changes. Why?
As technology has changed over time, so has the sophistication of our mapping capabilities and TIGER (Topologically Integrated Geographic Encoding and Referencing) database. Our newer maps include more features such as streams and small lakes that weren't visible in the 1990 or 2000 maps.
I want to download the data. How can I do that?
The "data" link in the bottom right-hand corner will take you to American Factfinder. From there you can access and download the Census 2000 and ACS data. You can access 1990 Census data from: https://www.census.gov/prod/www/decennial.html
Leave a Reply
Want to join the discussion?Feel free to contribute!