September 2026 and YTD Housing Market Report w/Interactive Price-Layered Map
PALM COAST, FL – October 14, 2026 – Flagler County’s October 2026 and YTD housing report. September home sales and total sales remained strong but fell year over year for the first time since January. While the median selling price for Flagler County homes (as reported by MLS) remains within a narrow band at $378,438, confidence in this metric has waned.
Production builders have disguised price cuts by utilizing interest rate buydowns, contributions towards closing costs, and free upgrades. These concessions don’t affect the reported selling price. One source says that the total value of builder concessions is likely in the $50,000 to $60,000. The middle market ($250K to $499K) shows this strategy’s effects most clearly. 86.3% of new construction falls within this price range. Only 76.3% of the overall homes fit this criterion.
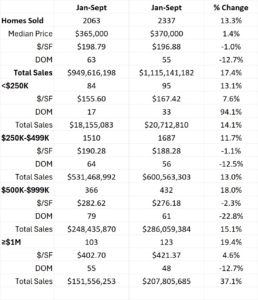
Let’s look at the September highlights, along with an interactive map showing September Flagler home sales broken into four price levels, followed by a chart of 2025 vs. 2026 YTD statistics by price segment.
September 2026 Flagler County Housing Market Stats
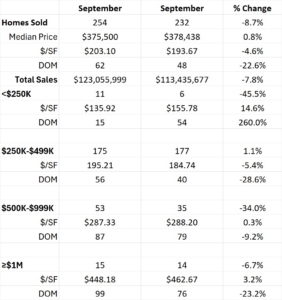
September Highlights:
This is the first month since January in which both home sales and total sales volume have declined year over year.
39.2% of the 232 homes sold were reportedly cash sales.
34.5% of all reported home sales were new construction.
155 single-family building permits were issued. The YTD monthly average is 173.
The inventory of homes listed for sale remained at 1,122 homes, the same as a month ago, but the decline in sales means that the months of inventory rose from 4.2 months to 4.8.
Interactive Map of Flagler Co. September 2026 Home Sales
The following map is layered by selling price. This highlights how location affects home values.
Click the drop-down address list (the upper-left corner icon) or the map pin to view the selling price, address, living square footage, price per square foot, and subdivision name.
Zoom in and out. The full-screen view is best.
Table of Flagler County housing stats YTD 2025 vs 2026
Commentary
Be mindful that this data presented reflects a cloudy view of the local real estate market, but it’s the best we have. As my 10-10-2026 podcast notes state, there are several reasons to be skeptical.
We are in a bifurcated market, divided east to west by physical barriers. The median price of all homes sold includes homes in The Hammock as well as Palm Coast homes built on traditional ITT lots. Think of it this way. If your body was half in the oven and half in the freezer, your median body temperature might be 98.6 degrees, but that’s not how you would describe how you felt.
New construction accounts for more than one-third of MLS-reported sales, but most custom builders don’t report sales through MLS. This is another bifurcation. MLS-reported new construction captures primarily frame-constructed homes. Production homes are also typically smaller. Existing homes are more likely to be block construction.
Concessions such as interest rate buy-downs, contributions toward closing costs, and free upgrades do not appear in the reported selling price or on the deed.
Last year’s increase in Palm Coast impact fees would have raised home costs by about $10,000. In fact, median selling prices have remained flat. Conclusion: values dropped.
Beware of AI-generated content. It suffers not only from the same dearth of factually verifiable information but also from the inability to articulate the inaccuracies.
If you are thinking about buying or selling property in Flagler County, call me first. Based on your goals, I’ll connect you with a qualified Realtor or builder and serve as your consultant throughout the transaction at no additional cost. Call me at 386-931-7124 or email me at Toby@GoToby.com.
Leave a Reply
Want to join the discussion?Feel free to contribute!