U.S. Census Bureau: State Government Tax Revenues Rose for Fourth Year in a Row
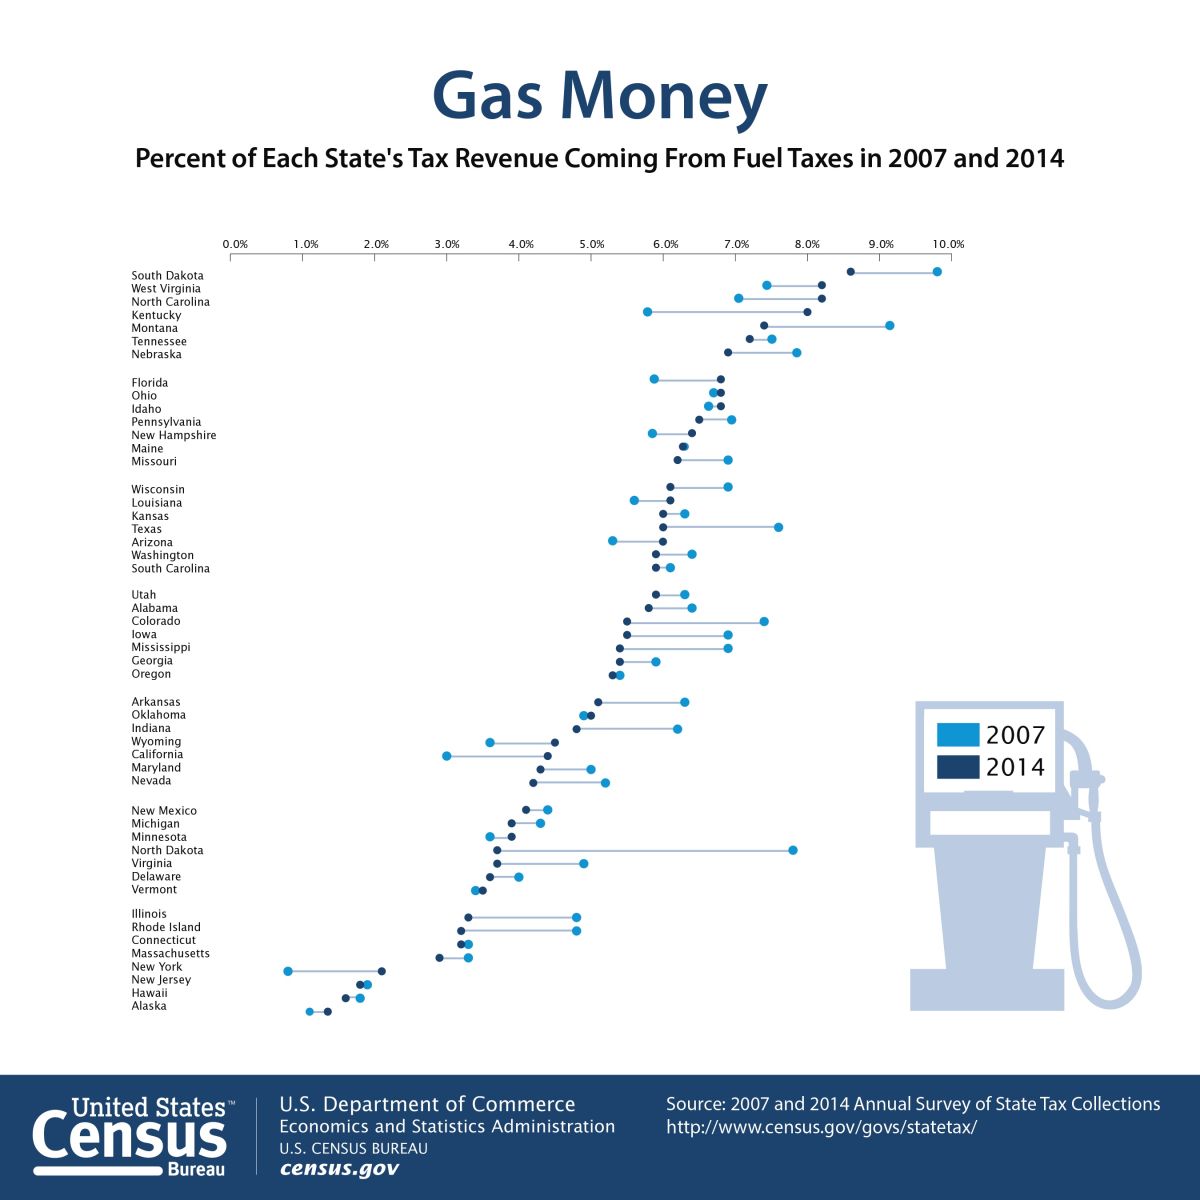
General sales and gross receipts taxes drove most of the revenue growth, increasing from $258.9 billion to $271.3 billion, or 4.8 percent. FL gas tax revenues decline.
 Palm Coast, FL – April 16, 2015 – State government tax revenue increased 2.2 percent, from $847.1 billion in fiscal year 2013 to $865.8 billion in 2014, the fourth consecutive increase, according to the U.S. Census Bureau’s 2014 Annual Survey of State Government Tax Collections.
General sales and gross receipts taxes drove most of the revenue growth, increasing from $258.9 billion to $271.3 billion, or 4.8 percent. Severance taxes increased 6.0 percent, from $16.8 billion to $17.8 billion, and motor fuel taxes increased 3.4 percent, from $40.1 billion to $41.5 billion.
“The Annual Survey of State Government Tax Collections provides a comprehensive look at the fiscal health of state governments,” said Kevin Deardorff, chief of the Census Bureau’s Economy-Wide Statistics Division. “State governments and businesses have been using these statistics since 1951 to make policy and investment decisions.”
The 2014 Annual Survey of State Government Tax Collections contains statistics on the tax collections of all 50 state governments, including receipts from compulsory fees.
Revenue statistics are broken down into 25 subcategories, such as motor fuel taxes, amusements taxes and hunting license taxes. Tax revenue statistics also include related penalty and interest receipts of the governments.
Highlights from the 2014 Annual Survey of State Government Tax Collections
States that showed highest percentage increases in total tax revenues from fiscal year 2013 to 2014 were:
- North Dakota: Increase of 15.5 percent, from $5.3 billion to $6.1 billion.
- New Mexico: Increase of 6.9 percent, from $5.4 billion to $5.8 billion.
- Texas: Increase of 6.7 percent, from $51.8 billion to $55.3 billion.
States that showed highest dollar amount increases in total tax revenues from fiscal year 2013 to 2014 were:
- California: Increase of $4.9 billion (3.7 percent increase), from $133.2 billion to $138.1 billion.
- Texas: Increase of $3.5 billion (6.7 percent increase), from $51.8 billion to $55.3 billion.
- New York: Increase of $3.3 billion (4.5 percent increase), from $73.7 billion to $77.0 billion.
States that showed highest percentage decreases in total tax revenue from fiscal year 2013 to 2014 were:
- Alaska: Decrease of 33.9 percent, from $5.1 billion to $3.4 billion.
- Delaware: Decrease of 5.1 percent, from $3.3 billion to $3.2 billion.
- Kansas: Decrease of 3.8 percent, from $7.6 billion to $7.3 billion.
States that showed highest dollar amount decreases in total tax revenues from fiscal year 2013 to 2014 were:
- Alaska: Decrease of $1.7 billion (33.9 percent decrease), from $5.1 billion to $3.4 billion.
- Ohio: Decrease of $496.3 million (1.8 percent decrease), from $27.5 billion to $27.0 billion.
- Arizona: Decrease of $387.6 million (2.9 percent decrease), from $13.5 billion to $13.1 billion.
Posting its fourth consecutive increase, the nation’s corporate net income tax rose 3.1 percent or $1.4 billion, from $44.9 billion to $46.3 billion.
Individual income tax increased 0.4 percent or $1.1 billion, from $309.7 billion to $310.8 billion.
Individual income tax and general sales and gross receipts taxes accounted for two-thirds (35.9 percent and 31.3 percent, respectively) of total tax revenues in the 2014 fiscal year. Individual income tax totaled $310.8 billion and general sales and gross receipts taxes totaled $271.3 billion in 2014.
Amusements licenses and alcoholic beverages licenses showed the highest percentage in decreases. Amusements licenses decreased 22.1 percent, from $606.4 million in 2013 to $472.3 million in 2014. Alcoholic beverages licenses decreased 12.4 percent, from $690.9 million in 2013 to $605.5 million in 2014.
Note: These statistics do not include employer and employee assessments for retirement and social insurance purposes. Also excluded are collections for the unemployment compensation taxes imposed by each of the state governments. These statistics include tax collections for state governments only; they do not include tax collections from local governments.
Leave a Reply
Want to join the discussion?Feel free to contribute!