The Flagler County Housing Growth Myth
December 10, 2025 – PALM COAST, FL – Debunking the Flagler County housing growth myth. As social media proliferates, so too does the anti-growth clarion bell of developer and Realtor bashing. Stressed infrastructure is easy to blame on excessive growth, but deferred maintenance is the real culprit.
Background – Palm Coast is the gorilla in the room.
Elected Palm Coast officials have kicked the regular infrastructure maintenance can down the road for years, but that is only half the problem. Hundreds of miles of streets, underground water, and sewer pipes were constructed when Palm Coast was born. The 50-year-old infrastructure has begun to fail all at once. The bill for catching up is being shouldered by a property tax and rate-paying population only half the size of the projected 225,000 residents for whom Palm Coast’s system was planned.
Several Flagler Beach residents have recently spoken out against a proposed annexation, but, again, Flagler Beach’s most critical issue is deferred maintenance at its wastewater treatment plant. At a recent Flagler Beach city council meeting, the lack of remaining space for growth on the city’s beachside was cited for its negative implications for the property tax base. How ironic.
Read: Unearthing the Root Cause of Palm Coast’s Infrastructure Issues
At some level, NIMBYism lurks within each of us, so bashing new housing developments is a natural reaction by residents frustrated by failing infrastructure and rising utility rates. Politicians are easy targets too, since they approve utility rate increases and enabling zoning changes.
Is growth the real problem, or is it simply a magnifying glass exposing the underlying problem? Do claims of unbridled growth stand up to scrutiny? They do not. It’s not even close. A picture really is worth a thousand words.
The chart below shows the number of residential building permits issued by all jurisdictions in Flagler County between 2003 and 2025. The single-family category includes single-family homes with duplexes counted as two units each. Multi-family includes townhomes, apartments, and condominiums.
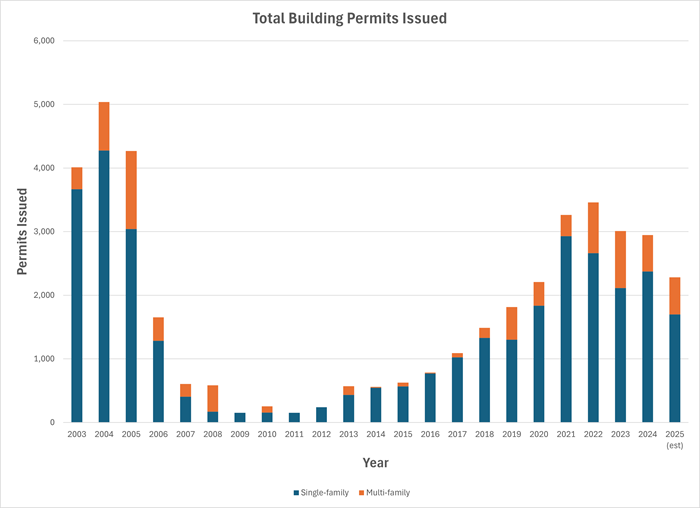
Clearly, the permitting rate remains well below the level during the housing bubble of the early 2000s. And the number of permits issued has been declining steadily since the Covid-inspired peak in 2022.
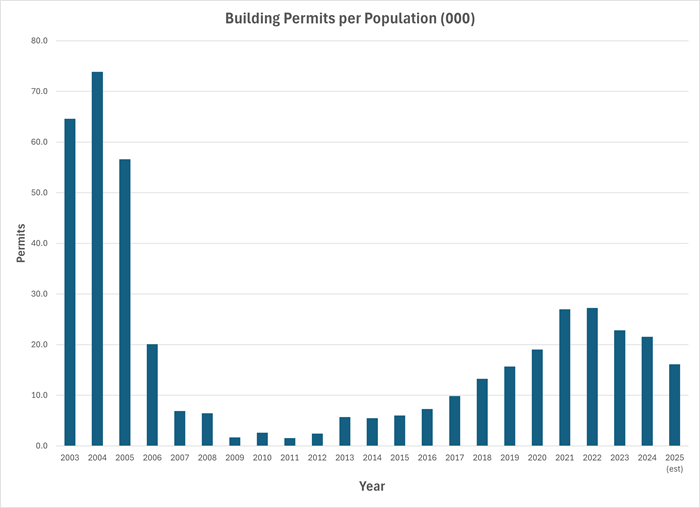
But the chart ignores the fact that the county’s population has expanded by 128% since 2003. A more accurate depiction combines permits issued with population growth. The following chart does just that, showing the number of permits issued per 1,000 county residents. The result is a clearer picture of the development of new residential construction. Clearly, our infrastructure “crisis” cannot be blamed on growth.
Leave a Reply
Want to join the discussion?Feel free to contribute!