Palm Coast Real Estate Market Continues to Offer Buyers Opportunities
Volume continues to strengthen. Prices remain low but are not weakening further. The ‘For Sale’ inventory is starting to climb with the arrival of shadow inventory.
Palm Coast, FL – June 23, 2010 – Palm Coast and Flagler County’s housing market remains stable during these turbulent times. In fact, there has been little change for several months. But that’s good news because underlying signs are pointing in the right direction.
Of the several measurements I track, here’s what’s happening:
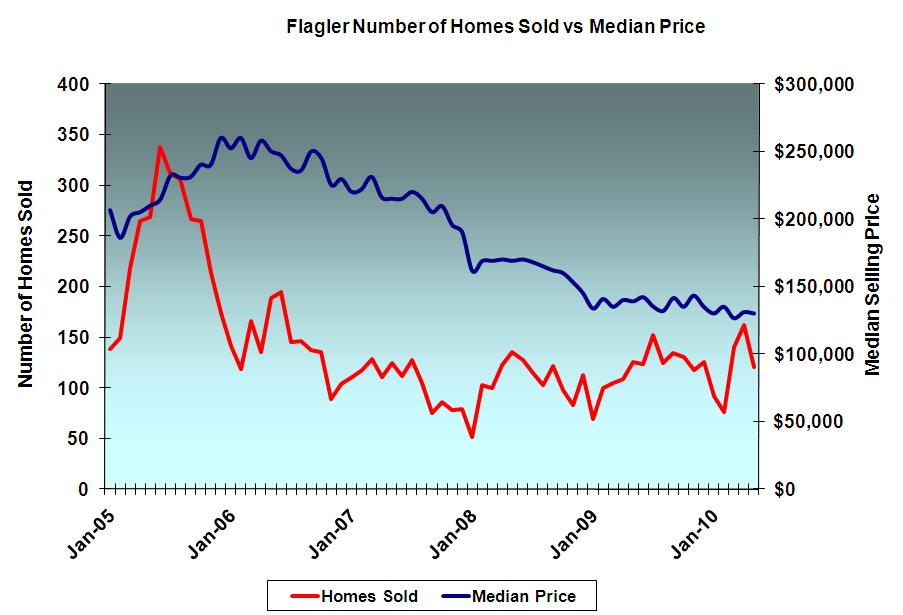
Median Price
Median selling price (half sold above and half below) remained stable between $126.5K and $134.5K each month. However, each 2010 month was shy of the comparable month a year ago by 2.7% to 6.5%. Most people focus on selling price because they can relate it to the potential value of their own home, but selling price is not what we should be watching if we’re looking for early indications of a strengthening market. Price is a lagging indicator.
The median price for a single-family home in Flagler County in May was $130,000. That’s well below the national median price of $179,400 and Florida’s median selling price is $140,100.
Inventory
Inventory represents the total number of units available for sale at any one time. During the bottom of the market, Flagler County MLS’s inventory of single-family homes hovered above 2,600. In recent months, inventory had dropped to near 1,300. It recently began a slow increase and currently sits at 1,383.
Real estate is a supply and demand market, so lower inventories tend to favor the seller (less competition) while rising inventories tend to favor the buyer (more choices). But the inventory number alone can be misleading. Inventory did not drop from over 2,600 to nearly 1,300 because sales were robust. In fact, it declined while both unit sales and median selling prices were also dropping. How can that happen? Selling prices were influenced more and more by distressed properties (lender-owned via foreclosure or short sales) coming onto the market. Potential sellers who could opt to wait decided they did not want to compete with distressed properties by removing their homes from the market or simply letting their listing agreements expire. They still want to sell, but not at today’s prices. I call this the shadow inventory or "pent up supply." The slight increase in inventory over the last month or so is likely coming from this source.
Absorption Rate
Absorption rate looks at inventory and the number of homes sold in combination. It is simply inventory divided by the number of units sold per month. An average of 146 homes sold monthly during the past two months. With inventory sitting at 1,383, the absorption rate is 9.47. [absorption rate] More revealing is a look at the absorption rate within market segments. For homes under $200K, the Flagler MLS absorption rate is 6.12, indicating a "normal" range. For homes between $200K and $300K, it is 14.35; still high, but down from 20.2 last August. The segment above $300K is the weakest with an absorption rate of 51.18, meaning that there is over 4-years inventory on the market within that price segment.
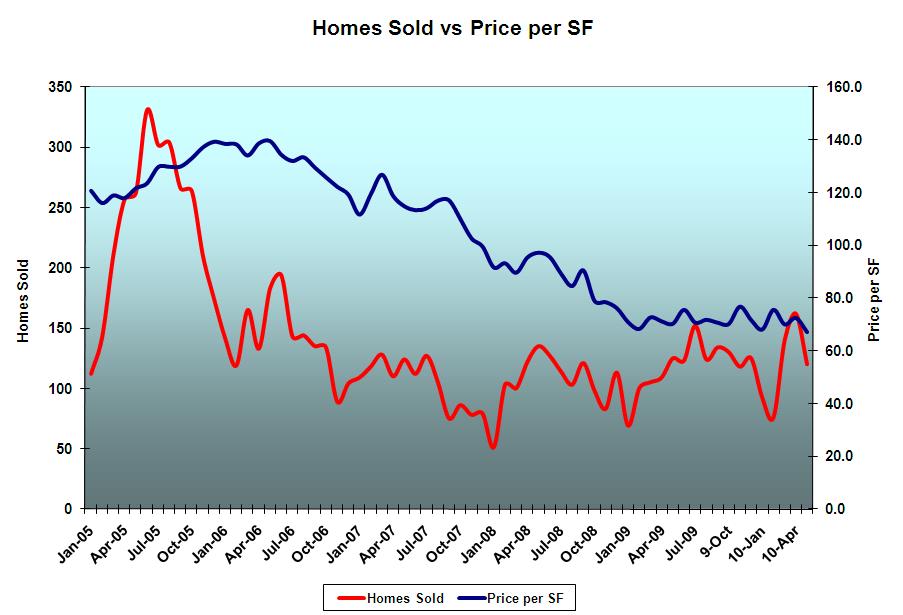
Price/Square Foot
Dollars per square foot ($/SF) is simply the total price paid for a house (including lot) divided by the number of square feet of living space (under air). Both median selling price and $/SF are running at about 50% of their market peak. Don’t conclude that your house’ value has also dropped by 50%. The decline in median selling price and $/SF is partially driven by the fact that distressed properties (mostly under $150K) account for over 50% of sales. At the market’s peak, distressed sales were practically non-existent.
Total Sales
Probably the best measure of the housing market is total sales volume; the total value of all sales during the measurement period. Sales volume is what drives governmental revenue through doc stamps. It drives real estate commissions too. It is sensitive to both price and unit sales. Total monthly sales of Flagler County single-family residential homes sold through MLS topped out at nearly $87 million in August 2005. It bottomed in January 2008 at barely $10 million. That’s an 88% decline.
[I joked to someone this week that I had three equally promising pillars to my retirement plan; my Wednesday night poker game, my weekly lottery ticket purchase, and my real estate license.]
Units Sold
The number of homes sold during a period is unit sales. Unit sales along with total sales are the most sensitive measures of market activity. When people stop buying, as they did in mid-2005, the effect on unit and total sales is immediate. From July ’05 to July ’06, monthly unit sales dropped 35.2%. Total sales dropped 34.2% over the same period. Meanwhile, median selling price and $/SF continued to rise for several months before starting their decline. By July ’06, they remained slightly above the previous July levels as they continued their slower decline.
What does it all mean?
A market in motion tends to stay in motion. It took months before people realized it wasn’t a buyer’s market any more. There was just so much momentum. The same will prove true at the market’s rebound. Units sold bottomed out and began a slow but steady rise two years ago. But the market outlook, fueled by continuing price declines and negative reporting, remained somber. Just as it took months for both buyers and sellers to realize the downturn, it will likely be several months before a price upturn becomes apparent.
This is a great time for buyers. It will continue to be a great time for buyers for months to come. I do not expect prices to move soon in either direction. That doesn’t mean I’m not bullish on the market. Keep a watch on the units sold and total sales volume. As long as they are trending up, the market is improving.
High-end Foreclosures in May
The list of foreclosures (lis pendens) of Flagler County properties filed in May included:
-
Bella Harbor – One condominium unit
-
Canopy Walk – Two condominium units
-
Cinnamon Beach – Two condominium units
-
Conservatory – Two lots
-
European Village – Two condominium units
-
Grand Haven – Construction parcel w/two partially completed condominium buildings and one lot
-
Hammock Beach – One 1-bedroom condominium and two lots
-
Harborside Village – One condominium
-
Hammock Dunes – Two condominium units
-
Ocean Hammock – One home
-
Ocean View Manor – One condominium unit
-
Palm Coast Resort – One condominium unit
-
Tedelands – Six condominium units
-
Village at Palm Coast – One home
June sales are expected to finish strong. Contracts that qualified for buyers tax credits must be closed by June 30, after which sales are expected to decline somewhat. It will be interesting to see how much the sales momentum created by the tax credit carries beyond the end of the program. Congress is considering a three-month extension of the closing deadline, but its passage remains uncertain.
Become a Member of GoToby.com: Receive email notices of news, rumors, newsletters, and articles. [click here] It’s free.
Leave a Reply
Want to join the discussion?Feel free to contribute!