Palm Coast Lot Sales as Indicator of Market
 An important component in the price of a home is the value of the underlying land. Actual construction costs can rise for several reasons:
- General inflation in the economy
- Shortages of building materials
- Labor shortages
- Additional cost of upgrades in building codes
- Impact fees
These all contributed to the run up in home value from 2001 to 2005. However, the largest factor in the home value increase was the rise in the cost of building lots. The most common commodity for measuring this in Flagler County is the "Palm Coast Lot." These are the 40,000 lots originally platted by ITT when Palm Coast was born over 30 years ago. These are the lots in the sections referred to by the first letter of their street name (the P section, the R section, the F section, etc.). They are valid indicators because they are fairly uniform, there is a large number of them, and there is an active market for them.
When I first moved to Palm Coast in early 2000, a Palm Coast Lot (PCL) without canal frontage could be purchased for $4-6K. This price held steady for about a year. Then in 2001, the climb began as builders, speculators, and new home buyers competed for lots. Soon the prices were in the $30K’s and continued to rise from there, mirroring the increase in the rise of home values over that same period. I recently analyzed the past 30 months of sales of PCL’s. What I found confirms that the local real estate did indeed peak in mid 2005. It also shows that, in fact, the market has dropped significantly. We need to look at the market in two ways:
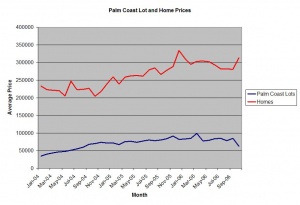
- Price – The prices of PCL’s has edged down somewhat but not much, again mirroring the market for existing single-family homes.
- Total sales volume – The total value of monthly PCL sales in September of 2006 was $1,772,400, off from $14,004,580 in September a year ago. This is a drop of $12,232,180 or 87%.
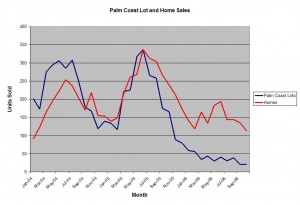
 Both items are important. The first shows that there is still some demand at current pricing. This gives us some comfort, but the fact that total sales volume is off by 87% tells us that this is not a healthy market. The only people buying now are the ones that don’t have a reason to wait. Everyone else is sitting on the sidelines to see if prices might go a little lower. The sheer drop in the number of sales is startling, falling from a high of 337 in June ’05 to 21 in September ’06. It’s also taking longer to sell a lot. The average number of days on market has risen from a low of 35 days in August ’04 to 129 days in October ’06 (month to date).
Palm Coast Lots sales can be summarized as follows:
- Inventory up
- Prices slightly down
- Sales volume down sharply
How accurately does this reflect the market for the sale of existing single-family homes in Flagler County? Actually, quite accurately:
- Total sales volume for homes was down 43% from September ’05 to September ’06.
- Both the sales volume curve and the number of sales curves for PCL’s and homes exhibit the same behavior.
- The homes curve is slightly less smooth, possibly reflecting the fact that there are fewer home sales per period, making this measure more sensitive to a single large transaction. (In the partial month of October, PCL prices show a decline while home prices show an advance but the home sales include two transactions that totaled $3.875M.)
Conclusion: Palm Coast Lot sales are a good barometer of the Flagler County single family home resale market.
In my next newsletter, I’ll compare the PCL figures with condominium sales.
Toby Tobin
Leave a Reply
Want to join the discussion?Feel free to contribute!