March 2017 Flagler-Palm Coast Real Estate Summary
How do we stack up? You might be surprised. Comparing national, state and MSA (Volusia/Flagler) results.
PALM COAST, — April 24, 2017 – The National Association of Realtors® and Florida Realtors® have released results of March home sales activity. How does the Flagler/Palm Coast market measure up?
About a year ago, GoToby.com noticed a dramatic change in the locally available single-family home inventory. After experiencing years of distressed homes (short sales and foreclosures) as an integral part of our available “for sale” inventory, that segment dried up. Loss of an available inventory of distressed, primarily vacant, inventory has limited buyers’ options and changed their behavior.
Two changes stand out. First, the obvious. With very few distresses homes available, bargains were scarce, forcing buyers to chase non-distressed homes with higher prices or new construction. With more non-distressed comps, it became easier to obtain financing. Sellers gained more control over pricing.
The second change was less obvious. Our population is growing at a rate above the national average, but growth was not evident in the real estate market as new home construction languished and prices rose modestly. Readily available inventory of vacant distressed homes absorbed much of the incoming population, masking population growth and keeping prices down.
It’s been a year since the market began to correct for the new reality. Demand created by population growth can be satisfied only by the addition of new residential construction; homes, condos, apartment. But a nationwide shortage of skilled construction workers is holding new construction back. At the current rate of new home construction, Flagler County will fall short by several hundred units this year.
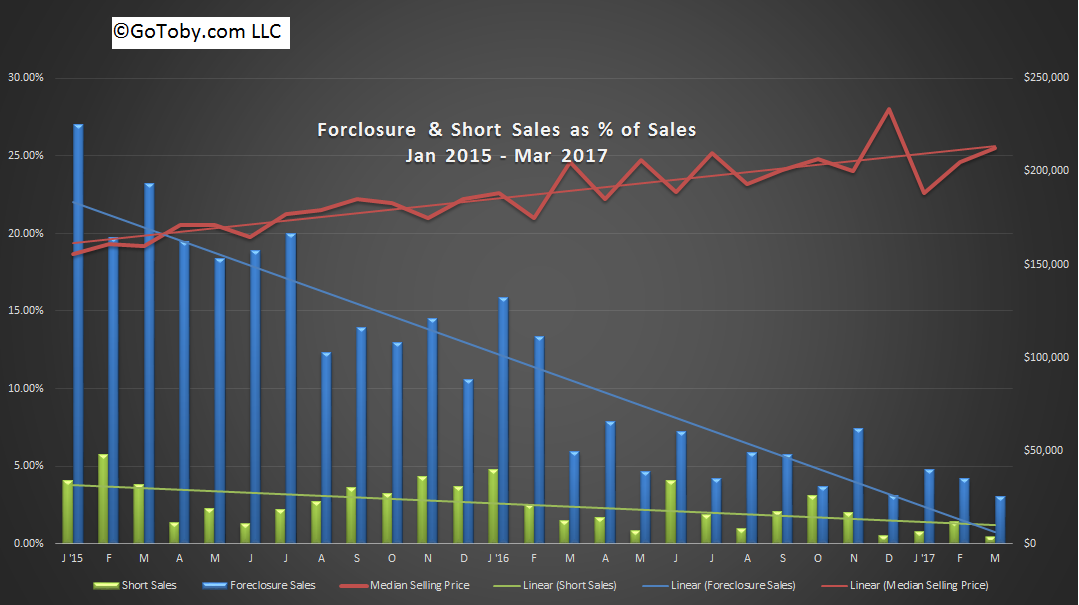
Flagler/Palm Coast real estate has demonstrated a history of volatility, with market swings exceeding the general market. This has been true in several metrics; home sales, median prices, foreclosures, short sales and new construction. Our peak was higher, our bottom was deeper and our recovery slower; slow because of the drag of distressed inventory.
DECLINE IN DISTRESSED HOME SALES
Here is how we compare to other markets – March 2017 vs March 2016
Single-family home (SFR) sales (closings)
- Flagler County – 230 homes sold +12.75%
- Volusia/Flagler MSA – 1,103 homes sold +2.3%
- Florida – 25,921 +9.3%
Median SFR selling price
- Flagler County (all) – $212,500 +3.7%
- Flagler County (non-distressed) – $ $219,995 +6.0%
- Volusia/Flagler MSA – $185,000 +12.0%
- Florida – $231,900 +10.4%
- U.S. Southern region – +8.5%
- U.S. – $237,800 +6.6
Distressed sales
- Flagler County – 3.4%
- Florida – No longer reporting
- U.S. – 6%
Cash Sales
- Flagler – 37.4%
- Florida – 29.2%
- U.S. – 23%
For the first time in years, Flagler’s distressed home sales percentage is below the national level. Through the first quarter, the SFR median price is up 9.3% from the same period last year.
Market outlook – good to excellent!!
Source: Flagler MLS – Flagler County properties only
Leave a Reply
Want to join the discussion?Feel free to contribute!