Palm Coast Residential Real Estate Market Turnaround Gathers Momentum
The corner has been turned. Sales of Single-Family Homes in Palm Coast and Flagler County continue to rise.
Palm Coast, FL – May 11, 2010 – GoToby.com thinks the Palm Coast/Flagler housing market is getting stronger. As I began to assemble this monthly newsletter, hedge fund guru John Paulson predicted a housing market turnaround this year. He forecasts a 3% to 5% price rise this year and an 8% to 12% growth in 2011. From my vantage point, he may be right. April was a strong month for home sales in Palm Coast.
MLS reported 155 Flagler County single-family home sales closed in April. That’s the highest number of homes sold in a single month since June 2006. There were only 109 homes sold during April ’09.
The first quarter represented the eighth successive increase in year-over-year quarterly unit home sales in the county. Although increased unit sales were offset by lower prices, the trend is a positive indicator, especially since prices have stabilized. It appears that there is sufficient buyer demand at today’s prices to continue clearing out the inventory of distressed properties (lender-owned via foreclosure or deed in lieu and short sales).
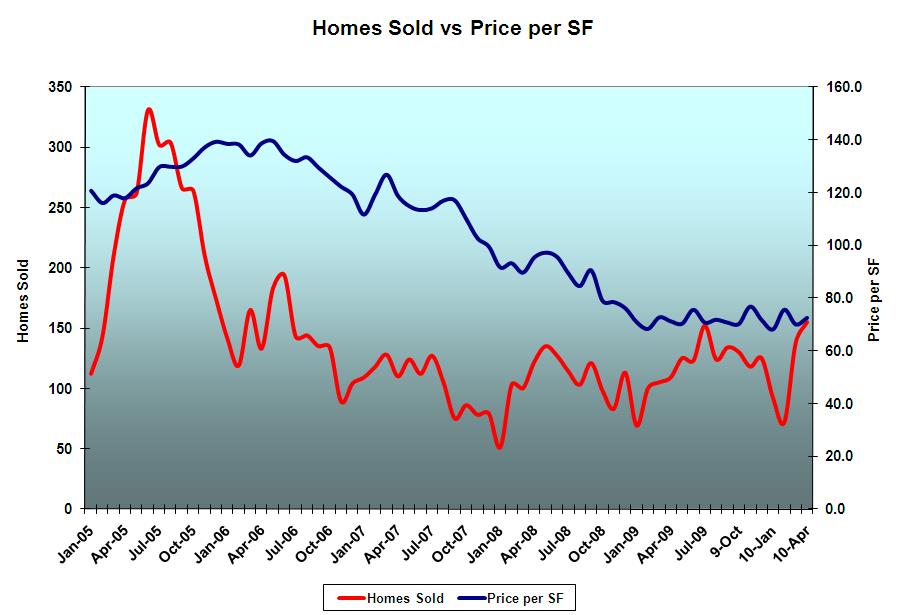
The following charts help to illustrate the market’s behavior over the past five years. In both the Homes Sold vs. Price/SF and Homes Sold vs. Median Price charts point out that neither Median Selling Price nor Median Price per Square Foot are sensitive to market changes. In fact, they lag the market. I believe that’s because sellers are both slow to recognize changes and resistant to price reductions.
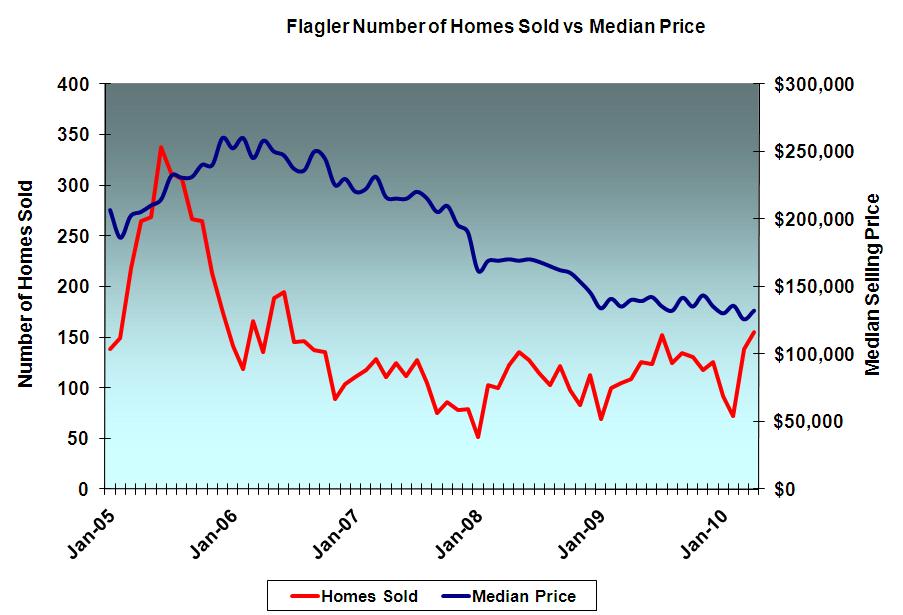
It’s hard to recognize a falling market when prices are dropping slowly. That’s why so many sellers, including myself got caught following a declining market with successive but belated price reductions while the real market was swiftly falling – well ahead of our adjustments. After all, median selling prices continued to rise for several months after the number of homes sold began its steep decline. That’s because sellers continued to behave as if it were still a sellers’ market. By the time most sellers recognized their dilemma, they were underwater with their mortgage with few options left.
The best indicators of market changes are the Number of Homes Sold and Total Sales Dollar Volume. Both indicators quickly adjusted in mid-2005 to an abruptly changing market. In fact, in the last chart you can see how tightly these two indicators are linked.
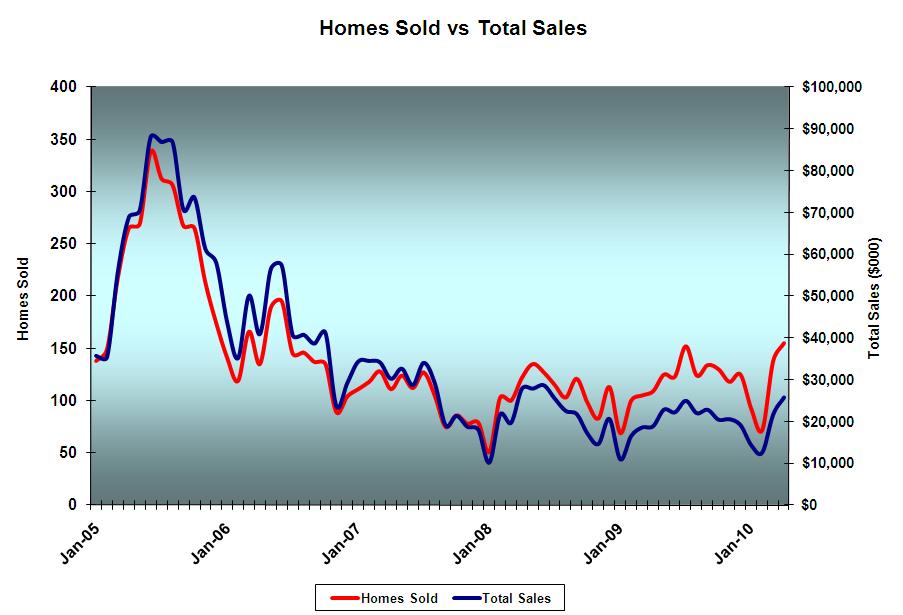
Will these two measures also signal a market upturn ahead of price changes? I think they will. In fact Homes Sold led Total Sales in the decline (the red line is below the blue line) but at the beginning of 2009, that pattern shifted. The number of homes sold is rising slightly ahead of total sales (the red line is above the blue line). Prices will not rise quickly. Expect the next price increases to slowly follow units sold because both sellers and buyers will continue to behave as if it were a buyers’ market.
I’ve said in the past that we won’t know when we hit the bottom of the market until after it happens. We will have to look back – first because sales numbers measure closed sales. But closings occur several weeks after the sales contract is signed bilaterally; sometimes several months with short sales. This means that the closings we see in April are the result of sales contracts signed much earlier. We won’t see the results of May sales contracts until they close – months or at least several weeks from now. Second, one month does not signal a trend. It takes several. That’s why I often look at quarters rather than months.
Look again at the last chart. Sales always dip at the beginning of the year, but January ’08 is the lowest in both units sold and total sales. Since then, eight quarters of increase in year-over-year unit home sales. This is definitely a trend. Lately, the increase in units sold is accelerating. I think the market is actually stronger than it appears to be.
The lesson learned is that we should watch units sold and total sales volume, not selling price if we don’t want to repeat our mistakes.
Other News:
There continues to be more activity at the higher end of the market, both in condominium and second home sales. The difference is that high-end doesn’t mean what it used to mean. Prices are definitely down, but on the up side, buyers are becoming more plentiful. A number of high-end properties continue to enter the "distressed" category, puting downward pressure on prices, giving buyers more choices, but strick lending criteria for condominiums and the lack of jumbo loan abailability still hinders the segment.
April foreclosure notices to owners of high-end properties included:
-
Hammock Beach – 2 condominiums
-
Surf Club – 2 condominiums
-
European Village – 3 residential condominiums
-
Tidelands – 5 condominiums
-
Grand Haven – 4 lots and 2 homes
-
Conservatory – 1 lot
-
Hammock Dunes – 2 condominiums and 1 home
-
Oceanside at Beverly Beach – 1 condominium
-
Marina Cove – 1 condominium
-
Cinnamon Beach – 3 condominiums
-
Village at Palm Coast – 1 lot
-
Yacht Harbor Village – 1 lot
-
Ocean Hammock – 1 lot
-
Palm Coast Plantation – 1 lot
Tax Certificates and Tax Deeds:
Today, Flagler County published the 2009 Delinquent Property Tax Roll. Properties on which the taxes remain unpaid by the end-of-day May 28 will be subject to a Tax Certificate auction. June also signals the two-year anniversary for Tax Certificates sold for delinquent 2007 property taxes. Expect to see several tax deed sales in the upcoming months. More on Delinquent Taxes, Tax Certificates, and Tax Deed Sales in future postings.
Budgets and Property Taxes:
Taxing authorities have begun their budgeting process. Preliminary 2010 assessed values will be available soon. It’s the interaction between assessed value (minus exemptions) and budgets that determines the millage rate. Millage rate multiplied by your assessed value (minus exemptions) determines your property tax.
What to expect:
-
A significant decline in total countywide taxable assessed value. This may not include you if your Just (market) Value is still above your assessed value due to Save Our Homes. If you fit that category, your assessment may rise unless the new lower assessment is equal to or lower than your present assessed value.
-
Smaller budgets from most, if not all, taxing districts, but not small enough to compensate for the reduced taxable assessed values
-
Higher millage rates
Become a Member of GoToby.com: Receive email notices of news, rumors, newsletters, and articles. [click here] It’s free.
R.E. Market Turnaround
Despite what appears to be a turnaround, and b/4 we uncork the champagne, let’t give this market a little longer run. First of all, the prices, for the sellers, are nothing to write home about and it looks like a large percentage of sales involve repose and shorts. What does this do for the seller in the $300, $400, or $500,000 range. Toby, what would be your best guess for a turnaround time in the better priced home category? Thank you.
John
Bank owned statistics
Here are some interesting stats for all the bank owned mind set buyers out there
75 million residential properties in U.S
50 million of those include mortgages
8 million of those 50 million are in a bank foreclosure or short sale process.
Thats only 10% of the entire U.S. residential market which makes up foreclosure’s or short sales…..10%!!!
This market has nowhere to go but north.
Stop listening to the news!!!!!!
-Bob