Flagler-Palm Coast’s Housing Bull Market Continues Through the Pandemic
Never have active single-family home listings been outnumbered by homes under pending contracts. Building permits and lot prices are surging. Less than 1% of Flagler’s housing stock is for sale.
 PALM COAST, FL – February 14, 2021 – After a brief early pandemic dip in sales activity during April and May, the Flagler-Palm Coast housing market has been on a tear. There are no signs of a letup.
It is typical for the number of Flagler County single-family homes listed in the Flagler MLS to vary between 825 and 950. For the first time since GoToby.com has tracked the local market, active listings dropped below the 700 mark in June, then below 600 just six weeks later. This morning, there were only 336 active home listings, a drop of roughly 60% from the norm.
Condo listings too are down by the same amount with only 68 units listed as available. There are 84 units under pending contracts. Less than 1% of Flagler County’s housing stock is for sale.
√-Shaped Recovery
Clearly, much of the decline can be attributed to the reluctance of potential sellers to have strangers trooping through their home in the middle of a pandemic, but strong demand has played a role too. Pending sales have shown a sharp increase as our area is flooded with buyers, many from the northeast and upper Midwest, seeking relief from taxes, high Covid-19 death rates, and growing civil disobedience (riots).
A surge in new migration combined with the drop in available inventory has triggered a mini demand boom. The current 660 pending sales contracts are nearly double the “For Sale” inventory and presage home sales exceeding 300 in March and April.
Look at how the local housing market has performed since the √-shaped recovery manifested in June. Every metric has moved in a desirable direction. The following chart compares June 2020 to January 2021 market results to the same period one year earlier. The contrast is stark.
| Jun 1-19 | Jun 1-20 | % | ||
| Category | Jan-31-20 | Jan 31-21 | Change | |
| Homes Sold | 1654 | 2259 | 36.6% | |
| Median Price | $242,500 | $266,100 | 9.7% | |
| $/SF | 140.44 | 159.31 | 13.4% | |
| Sales Volume | $479,276,177 | $771,643,583 | 61.0% | |
| Median DOM | 44 | 34 | -22.7% | |
| %Selling Price to List | 97.78% | 98.55% | 0.8% | |
| Homes Sold >$1M | 12 | 44 | 266.7% | |
| Homes Sold >$2M | 1 | 9 | 800.0% | |
| SFR Permits Issued | 805 | 1232 | 53.0% | |
| PC Lots Sold | 479 | 887 | 85.2% | |
| Lot Median Price | $21,000 | $27,500 | 31.0% | |
| Lot DOM | 88 | 59 | -33.0% | |
| Lot Selling/List | 89.8 | 95 | 5.8% |
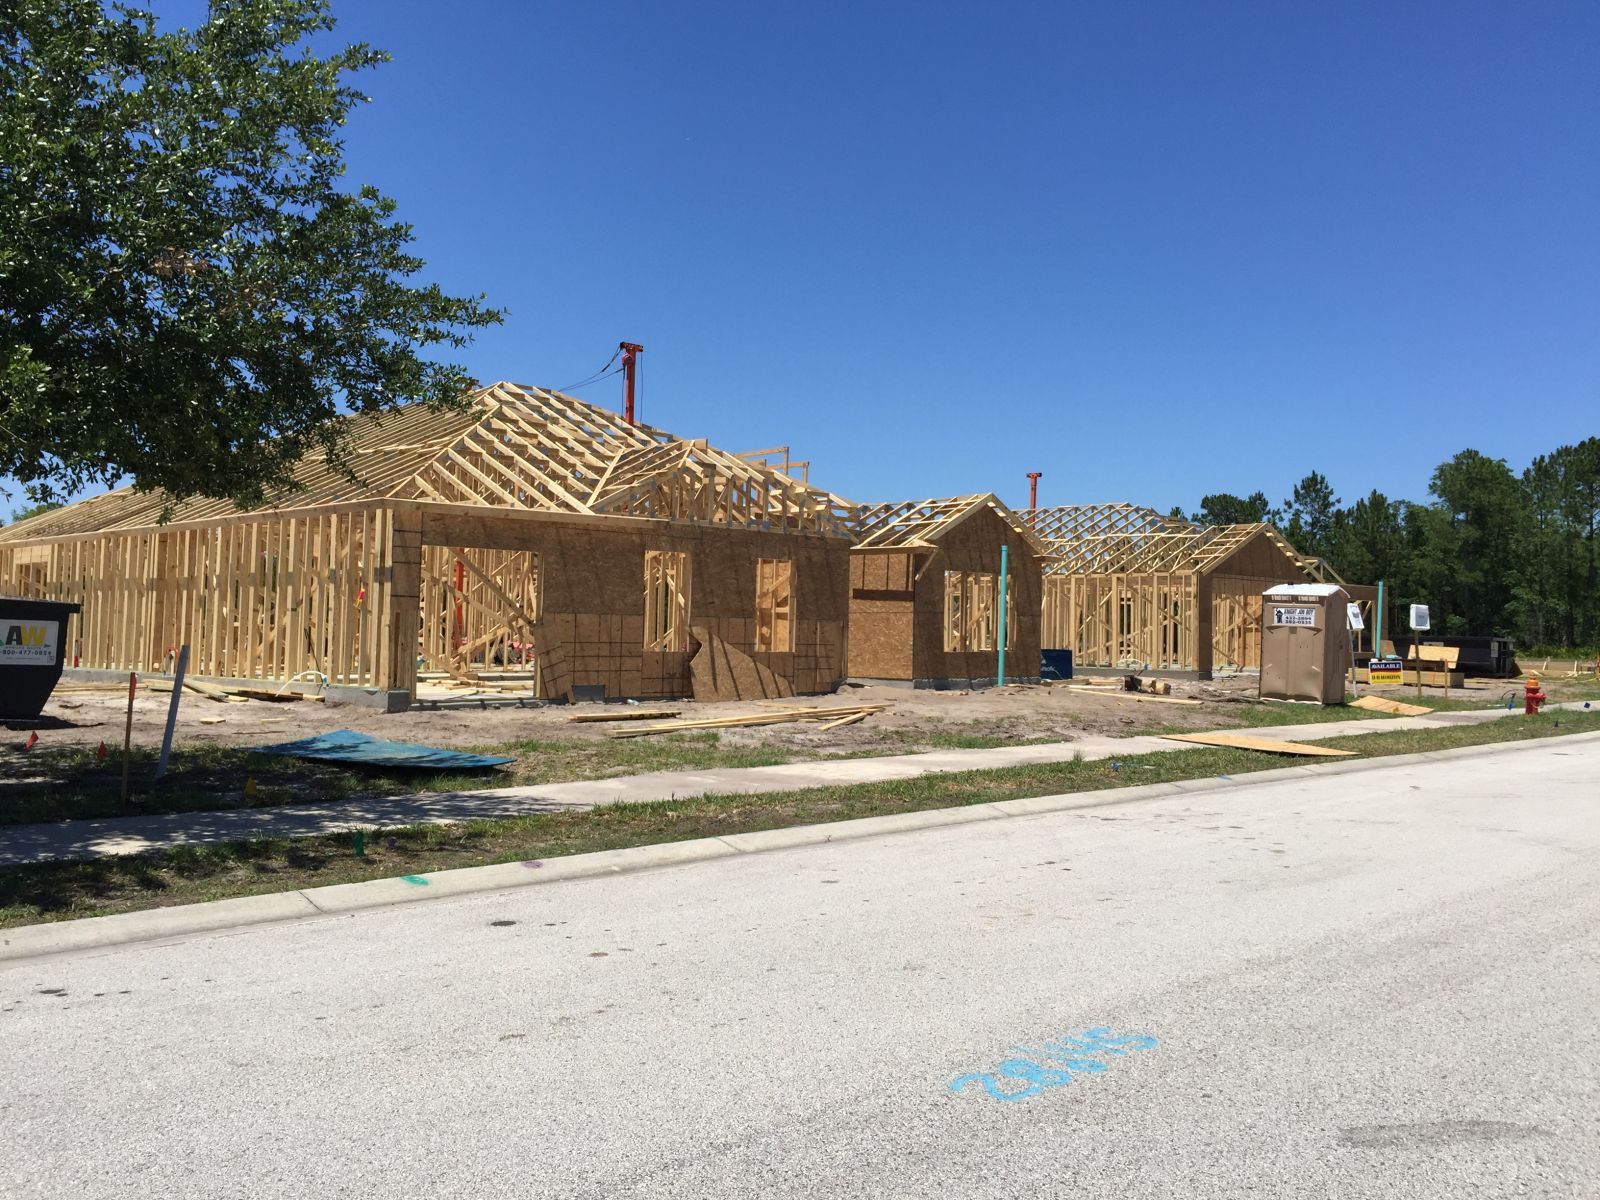
PC Lots in the above chart are standard ITT platted lots exclusive of those with golf course or saltwater canal frontage. They are typically 10,000 square feet. Like a commodity, they react quickly to market conditions. Their sales volume and selling prices are market signals that new construction is imminent. They are the canary in the coal mine. Beginning in November, PC lot prices have been at, or above, $30,000, reaching $34,900 in January and $38,000 month to date in February.
January Year-Over-Year Results for Flagler County
- Home Sales: up 24.3%
- Median Price: up 17.0%
- Price/SF: up 18.3%
- Single-family Home Sales Volume: up 49.2%
- Single-family Building Permits: up 60.6%
- Condo Sales: up 21.9%
- Condo Median Price: up 36.3%
- PC Lot Sales: up 100%
- PC Lot Median Price: up 68.6%
Leave a Reply
Want to join the discussion?Feel free to contribute!