Joaquin – Understanding Uncertainty of Hurricane Forecasting
You all know the NOAA Hurricane Probability Cone graphic. It portrays the expected track of a tropical storm or hurricane. Do you know how it is developed? Meet the aptly named Spaghetti Model.
PALM COAST, Fla. – October 1, 2015 – Northeast Florida watches again as a major hurricane goes somewhere else rather than here. Major storms, for whatever reason, seem to steer clear of Northeast Florida. But they do come close enough to focus our rapt attention as the media follows the National Weather Service’s satellite views, discussions and graphic representation of expected storm tracks.
Technology has greatly leveraged our ability to forecast. Satellite imagery, thousands of data collection devices and brave air crews feed millions of data points into super computers that churn out the latest prognostication.
Joaquin is the hurricane du jour. Here’s the probability cone as of 8:00 A.M. today.
.gif)
Because the forecast is produced by computer models, we accept its implied accuracy. However, the note on the above graphic warns us. “The cone contains the probable path of the storm center but does not show the size of the storm. Hazardous conditions can occur outside of the cone.”
Forecasting hurricanes is like forecasting the real estate market. It’s guessing. Analytics increase a forecast’s accuracy, but it’s still guessing. Let’s call it enhanced guessing.
There are several computer models that predict storm tracks, not just one. They have names; GFS, UKMET, GFDL, HWRF, UKMET, ECMWF, NHC (National Hurricane Center) and more. Some models are historically more accurate than others. The Spaghetti Model below represents the disparate tracks.
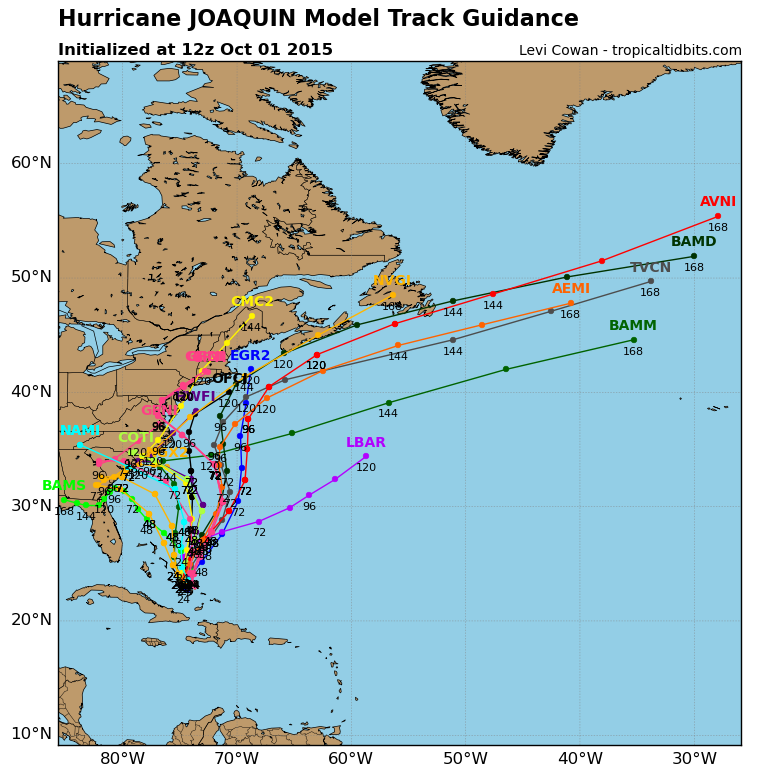
The National Weather Service develops its cone of probability by combining the many forecasts, then using simple human judgement. The following is from the 5:00 A.M. forecast “discussion.”
“By 36 hours, Joaquin should begin to move faster toward the north as it comes under the influence of a deep-layer trough that cuts off over the southeastern United States. There have been big changes in some of the track guidance overnight, perhaps due to data from the synoptic surveillance mission flown by the NOAA G-IV jet for the 00Z model cycle. In particular, the GFS and UKMET have shifted eastward by several hundred miles in 3 to 4 days relative to their previous solutions. Overall for this cycle there has been a spreading out of the guidance envelope beyond 2 days, with a wide range of solutions shown. The HWRF and GFDL are the fastest to bring Joaquin north out of the Bahamas and still show a sharp westward turn taking the cyclone inland over the Carolinas in 3 to 4 days. The GFS has trended slower coming out of the Bahamas and now shows a track toward Long Island and southern New England in 5 days, with the UKMET farther offshore. The latest ECMWF is still the slowest and farthest east with a track just west of Bermuda in 4 to 5 days. Given the large shift in some of the guidance, the NHC track has been adjusted just a little to the east and slower at days 3 through 5, and now lies on the left side of the multi-model consensus and left of the GFS, UKMET and ECMWF solutions. Confidence remains very low in the eventual track of Joaquin and any potential impacts for the United States, and further adjustments to the NHC track may be needed later today.” [Emphasis added]
We are spared again, but others may not be. They are in our thoughts and prayers as the cone of probability, updated every three hours, marches inexorably forward.
Stay informed by following:
Tropical Tidbits Blog
The following discussion was posted on Tropical Tidbits on Tuesday. Though a few days old, it demonstrates how widely varying tracks can arise.
Leave a Reply
Want to join the discussion?Feel free to contribute!