I’m Bullish on Palm Coast Real Estate in 2012
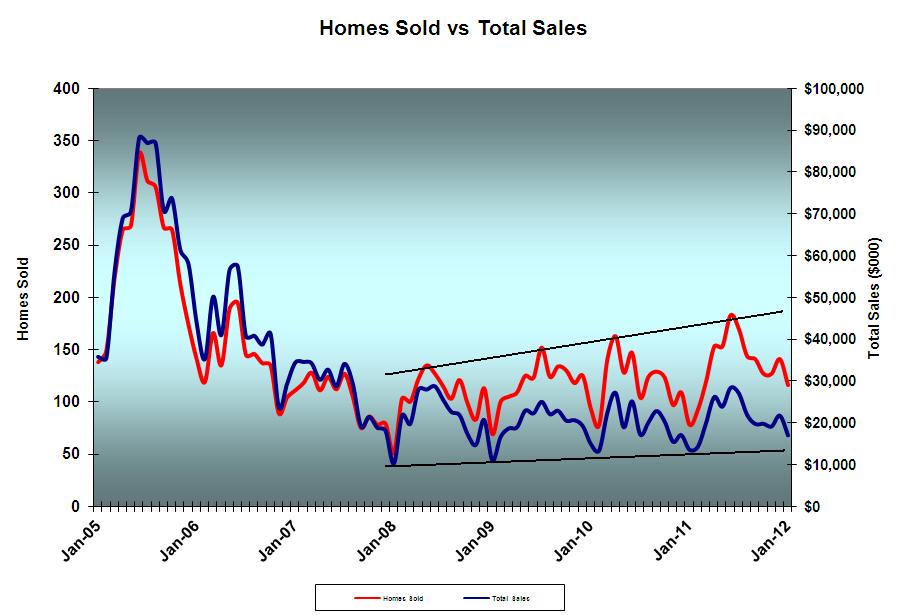
We’ve already seen recovery in the number of homes sold and the total value of all sales, but prices have remained stubbornly low. I think that’s about to change.
Palm Coast, FL – February 12, 2012 – There are three measurements of the housing market’s health. For Palm Coast and Flagler County, two measures have already shown a turnaround; homes sold and total sales. But until prices begin to rise again, nobody will be convinced that the bottom is behind us. I think 2012 will be the year for price recovery.
Homes Sold
In January, 116 single-family homes were sold through MLS in Flagler County, 48.7 percent more than during January 2011. January was the ninth consecutive year-over-year monthly increase. Home sales were up 25.3 percent over the full nine months; 263 more homes sold. Home sales have been recovering slowly since January 2008, when only 51 homes were sold.
Total Sales
The value of all January single-family home sales exceeded $17 million, up $3.45 million from January 2011. This represents about $200 thousand more commission dollars to feed the families and cover the expenses of Flagler’s real estate practitioners. Tied closely to homes sold, total sales also hit bottom way back in January 2008. Both measures respond to seasonal fluctuations, but both have been climbing slowly since. The rate of increase has begun to pick up.
Selling Price
Average selling price is affected significantly by the addition of a single high dollar or low dollar sale. That’s why median selling price (half sold above, half below) is generally considered to be a better measure. But it too is not perfect. The median price is sensitive to the mix of what is being sold. 57.8 percent of all January home sales were distressed properties; either lender-owned (via foreclosure or deed in lieu) or short sales. Because lender-owned properties are the most likely to have suffered from neglect and/or vandalism, they sell for the lowest prices. Short sales do a little better. Non-distressed homes fetch the highest prices. Note the range:
|
Homes |
Median Price |
% |
$/SF |
|
| January 2012 | ||||
| Total Sold |
116 |
$110,500 |
100% |
$61.50 |
| Short Sales |
32 |
$101,000 |
27.7% |
$55.00 |
| Lender-owned |
35 |
$88,500 |
30.2% |
$50.60 |
| Cash Sales |
60 |
$99,500 |
51.7% |
$57.00 |
| Non-distressed |
49 |
$151,000 |
42.2% |
$75.12 |
| January 2011 | ||||
| Total Sold |
78 |
$129,000 |
100% |
$64.00 |
| Short Sales |
25 |
$115,000 |
32.1% |
$53.61 |
| Lender-owned |
17 |
$97,020 |
21.8% |
$51.83 |
| Cash Sales |
46 |
$132,585 |
59.0% |
$68.50 |
| Non-distressed |
42 |
$155,000 |
53.8% |
$86.71 |
Interestingly, cash sales were not limited to distressed sales.
From January 2011 to January 2012, the selling mix shifted. Short sales dropped from 32.1 percent of all sales to 27.6 percent. At the same time, lender-owned sales rose from 21.8 percent to 30.2 percent. The shift in selling mix accounts, in part, for the drop in median selling price.
February and Beyond
Based on early sales reports; there is a strong possibility that February will be the first month showing a year-over-year increase in the monthly median home selling price since October 2006.
Other indicators point to a strong spring selling season. The inventory of homes listed for sale hovers around 1,000. That’s quite a low inventory number. The number of homes under pending (or contingent) sales contracts has grown to 562, up more than 10 percent in the last month alone. Agents and brokers are telling me that buyer interest has increased strongly. Buyers have waited long enough. They are ready to pull the trigger.
I think that 2012 will go down as the turnaround year for our housing market. We will look back a year from now and say, "Wow." And we haven’t said that in a long time; at least not "good" Wow.
Ladies & Gentlemen Boomers, Start Your Engines
Toby, I could not agree more. All those northern boomers are tired of waiting to begin the next phase of their lives. The combination of a rejuvenated stock market and incredibly low prices could result in a big boom. Should be fun…
Do you have your years backwards?
It seems your chart titles maybe backwards or your looking at the numbers the wrong way.
Just an opinion…
Do you have your years backwards?
I maybe reading this incorrectly but you stated – "From January 2011 to January 2012, the selling mix shifted. Short sales dropped from 32.1 percent of all sales to 27.6 percent. At the same time, lender-owned sales rose from 21.8 percent to 30.2 percent. The shift in selling mix accounts, in part, for the drop in median selling price."
Looking at your chart those numbers on stated in the incorrect years…Jan 2011 has 27.7 and Jan 2012 has 32.1 how is that a drop? It should be stated as an increase, NO? Please explain…
Not so fast…
I happen to be one of those so-called "Babyboomers". I am also a big fan of Palm Coast after "discovering" it 8 years ago looking for a Spring Break vacation destination for my family. Up north (New Jersey) has seen some pretty horrendous price drops as well (aprox 30 to 40%) since 2007. Problem is "evaporation" of equity avail for retirement homes. The only option at current market conditions for many is to stay at current jobs and ride it out or down-size and try to save for retirement. Either way, it looks like a minimum 10 year plan…so, "Exactly where is this fuel you speak of?" Trust me…I have it better off than the vast majority up here. Here is the math…(2007) 1 million (home) – $600,000 mortgage = $400,000 avail. (Today) $700,000 – $570,000 = $130,000 avail. THAT’S REALITY…
Reply to JP
I don’t think so.
2nd Reply to JP
You are right. The years were reversed. I’ve corrected the problem. Thank you.