

2020 Was a Record Year for Flagler County-Palm Coast Home Sales
GoToby.com has tracked Flagler County home sales since 2003. Despite a pandemic, or perhaps because of it, 2020 broke all the records for home sales.
PALM COAST, FL – January 16, 2021 – GoToby.com has tracked Flagler County home sales since 2003. Despite a pandemic, or perhaps because of it, 2020 broke the previous local records for home sales, surpassing numbers hit when Flagler County and Palm Coast were the poster children of the Housing Bubble.
Covid-19 √-Shaped Recovery
2020 began on a strong note. Home sales were up 17.6% year over year in the first quarter. The median selling price was $240,000, up a modest 2.1% from 2019’s first quarter. Signaling stronger demand, Median Days on Market (DOM) dropped 12% to 44 days.
Then Covid-19 struck. As the nation hunkered down, Flagler County home sales dropped 17% in April and 34.4% in May. New monthly pending contracts dropped to 128 in April, down 39% from a year earlier. Potential sellers were loath to have strangers trooping through their homes and buyers were reluctant to venture out.
But the upwelling demand somehow managed to overcome Covid-19 as potential buyers ventured out via the Internet and as the industry quickly mastered virtual showings and remote closings. An unforeseen √-shaped recovery was underway. It began with June results. It continues through today and likely well into the next few years.
Prior to June, the record monthly median selling price (via MLS) of Flagler County homes was $259,950, reached In December 2005. That number was finally surpassed in June and each succeeding month through the rest of the year. The record monthly sales volume for all single-family homes prior to the pandemic was $88.2M, achieved in June 2005. This number too was surpassed in June and in every month since most notably in September ($110.5M) and December (110.2M).
Other Notable Benchmarks
GINNdex: named in recognition of Bobby Ginn, who was largely responsible for putting Palm Coast on the map in the early 2000s. It is the ratio between Active and Pending listings and is an indicator of “market heat.”
It typically takes one-two months before closing once a contract for sale is signed (Pending). In a normal market, one can expect the number of Pending listings to be exceeded by the number of Active listings. For instance, on March 19, just as we began to feel the effects of the pandemic, there were 808 Active Flagler County MLS listings and 459 Pending listings. The GINNdex was 808÷459, or 1.76.
The number of Active listings has steadily fallen since March, dropping below 700 for the first time in June and to below 600 only six weeks later. Meanwhile, sales continued to climb. Since August, the Pending list has outnumbered the Active list – another first. On January 14, 2021, there were only 368 Active listings, significantly fewer than the 564 Pending listings. Today’s GINNdex is a mere 0.65. Twenty-four of the Pending listings were on the market only one day before going under contract.
Days on Market (DOM): The first quarter of 2020 had already shown a year over year 12% drop in median DOM to 44 days. During the period from June to December, the median DOM was only 32 days. It does not matter to the potential buyer that the low availability of for sale inventory is only partly due to increased demand with the remainder attributed to sellers’ virus fears. It only matters that there are few homes to choose from, creating a sense of urgency, bidding wars, and accelerated decision making.
Distressed Sales: During 2009, 2010, and 2011 (the bottom of the Great Recession), over 53% of all Flagler single-family home sales were distressed; short-sales of foreclosures. By 2019, distressed sales had dropped to only 2.3% of all sales. The percentage dropped even further, to 1.6%, in 2020.
During 2019, there were 286 new foreclosure filings compared to only 99 in 2020. The final step in a completed foreclosure is the sale of the encumbered property at auction. Foreclosure auctions result in the issue of a Certificate of Title (C/T – a type of deed). There were 139 C/Ts issued in 2019 and only 56 in 2020. 2019 ended with 293 Open foreclosure cases in Flagler County. 2020 ended with only 56. (In 2013, there were 1,000 C/Ts issued.)
Building Permits: Single-family building permits increased by 41.4% from 1,153 to 1,627. Duplex permits issued grew 35% to 124 (equaling 248 single-family units).
Multi-family permits issued dropped from 321 (The Palms at Town Center – 88 and Central Landings – 233) to 108 in 2020 (Tuscan Reserve). Several hundred more units are in the permitting process and are expected to begin construction within 2021. Both The Palms and Central Landings filled up immediately upon opening.
Palm Coast ITT-Platted Lots: Disregarding lots with saltwater canal or golf course frontage, the remaining 10,000 square foot ITT-platted lots represent the closest thing to a commodity in the Palm Coast market. Vacant lots typically are not desirable long-term investments. They do not produce income but have carrying costs: taxes and stormwater fees. That is why the sale of a building lot, to an individual or a builder, generally signals a near term intent to start construction of a new home, the proverbial canary in a coal mine.
During the bidding frenzy boom days in the early 2000s, the price of ITT-platted lots shot up from the low teens to $76,000 within a couple of years before returning to the teens after the bubble burst.
ITT-platted Palm Coast lots continued to sell in the teens until 2019. During that year, the median selling price hovered in the $20,000 – $22,000 range. 2020 saw a steady median selling price rise from $20,700 in January to $30,500 in December.
Year-End Summary
Homes
- Home Sales: 3,005 single-family homes were sold in 2020, an increase of 21.1% from 2,481 sold in 2019
- Median Price: Homes sold for a median price of $258,900, up 7.9% from $240,000 in 2019
- Price/Square Foot: $152.98, up 9.7% from $139.40 in 2019
- Sales Volume: $972,520,563, up an impressive 35.0% from $720,134,080 a year ago
Condos
- Condo Sales: 495 units sold, up 26.0% from 393 in 2019
- Median Price: $270,000, up 12.5% from $240,000
- Price/Square Foot: $206.01, up 9.5% from $188.09
- Sales Volume: $172,850,184, up 53.5% from $112,608,687
Winners & Losers
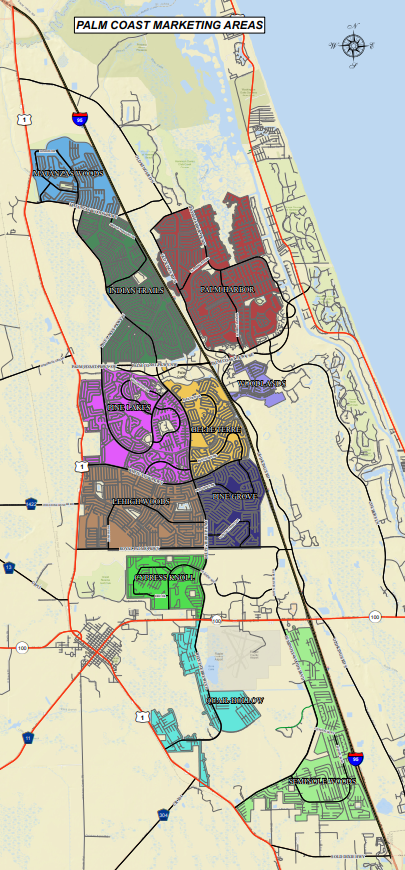
Some subdivisions fared better than others. Below are the home sales and median selling price results for subdivisions with 50 or more home sales in 2020. (The Hammock Dunes CDD includes Hammock Dunes, Island Estates, Harbor Village Marina, Cinnamon Beach, Hammock Beach, and Ocean Hammock.)
HOME SALES
| Subdivision | 2019 | 2020 | % Change |
| Belle Terre | 97 | 157 | 61.9% |
| Cypress Knoll | 80 | 106 | 32.5% |
| Grand Reserve | 49 | 76 | 55.1% |
| Indian Trails | 274 | 306 | 11.7% |
| Lehigh Woods | 249 | 301 | 20.9% |
| Matanzas Woods | 75 | 101 | 34.7% |
| Palm Harbor | 346 | 450 | 30.1% |
| Pine Grove | 134 | 184 | 37.3% |
| Pine Lakes | 259 | 273 | 5.4% |
| Quail Hollow | 75 | 86 | 14.7% |
| Seminole Woods | 110 | 135 | 22.7% |
| Grand Haven | 96 | 133 | 38.5% |
| Hammock Dunes CDD | 77 | 110 | 42.95 |
| Flagler County | 2,481 | 3,005 | 21.1% |
MEDIAN SELLING PRICE
| Subdivision | 2019 | 2020 | % Change |
| Belle Terre | $200,000 | $223,990 | 12.0% |
| Cypress Knoll | $274,500 | $285,261 | 3.9% |
| Grand Reserve | $212,990 | $225,000 | 5.6% |
| Indian Trails | $218,351 | $230,495 | 5.6% |
| Lehigh Woods | $207,900 | $222,990 | 7.3% |
| Matanzas Woods | $249,900 | $255,000 | 2.0% |
| Palm Harbor | $260,000 | $305,000 | 17.3% |
| Pine Grove | $217,700 | $218,500 | 0.4% |
| Pine Lakes | $224,000 | $238,000 | 6.3% |
| Quail Hollow | $215,000 | $229,850 | 6.9% |
| Seminole Woods | $217,000 | $237,500 | 9.4% |
| Grand Haven | $369,950 | $400,000 | 8.1% |
| Hammock Dunes CDD | $727,000 | $795,000 | 9.4% |
| Flagler County | $240,000 | $258,900 | 7.9% |
Palm Harbor prices demonstrate a mathematical fluke. The Palm Harbor market is divided into two quite different properties; those with salt-water or Intracoastal Waterway frontage and those without. The 2020 median price of the two categories was respectively $397,000 and $270,000. The median price of the waterfront homes rose 13.7%. Those without water frontage rose only 10.5%. What is the explanation for Palm Harbor’s overall median price rise of 17.3%? It was a change in the market mix between the two market segments. In 2020, waterfront homes comprised 44.7% of all Palm Harbor sales. In 2019, this category represented only 39.3%.
In 2019, 29 Flagler homes sold through MLS for $1M or more. Only one home sold for more than $2M. In 2020, 44 homes sold for $1M or more. Ten of them sold for more than $2M. Of the 2020 $1M+ homes sold, 40 were sold between June and December. All but one of the $2M+ homes sold in that same period.
The √-shaped recovery is gathering momentum and clearly carries a large wealth component. Three of the five largest median price percentage increase subdivisions have selling prices well above the overall Flagler County price level.
One component motivating new residents to move to Palm Coast (and all of Florida) continues to be the tax cuts of a few years ago that limited the amount taxpayers can deduct for state income taxes and property taxes. The effect of this change falls more heavily on the wealthy, prompting migration from high tax states to low tax states.
Covid-19 has reached pandemic levels in nearly all states, but the states with the highest death and hospitalization rates tend to also be in the high tax state category, primarily in the Middle Atlantic, Northeast, and upper Midwest. Summer riots occurred mostly in the same high tax and COVID-19 affected states. Wealth always seeks safety.
Wealthier people have more financial freedom, so they dominated the first wave of southern migration. High wealth people can move independently of selling their current home and are more likely to have funds available for a cash purchase. Between June 1 and December 31, Flagler home sales above the median selling price were 28.4% more likely to be for cash than those selling below the median price.
The pandemic brought lifestyle changes thought to be temporary, like working from home and avoiding crowded places while enjoying more open-air activities. (Golf, RVing, biking, and hiking have seen a resurgence this year.) Many people have reevaluated their priorities and chosen to make these changes permanent. Some have decided to retire earlier than previously planned or at least secure their future retirement home now.
Belle Terre subdivision numbers
Hi, Toby,
I hope that you are doing well! I’m looking at your stats and note that my neighborhood was not included (Belle Terre).
Bill
Reply to Bill Lyon
Sorry, Bill. An oversight that has since been corrected.